Enrichment Network Analysis
Nodes represent biomarkers; edges indicate pairwise overlap (Jaccard-like). These example networks are generic and can be adapted to any project or disease.
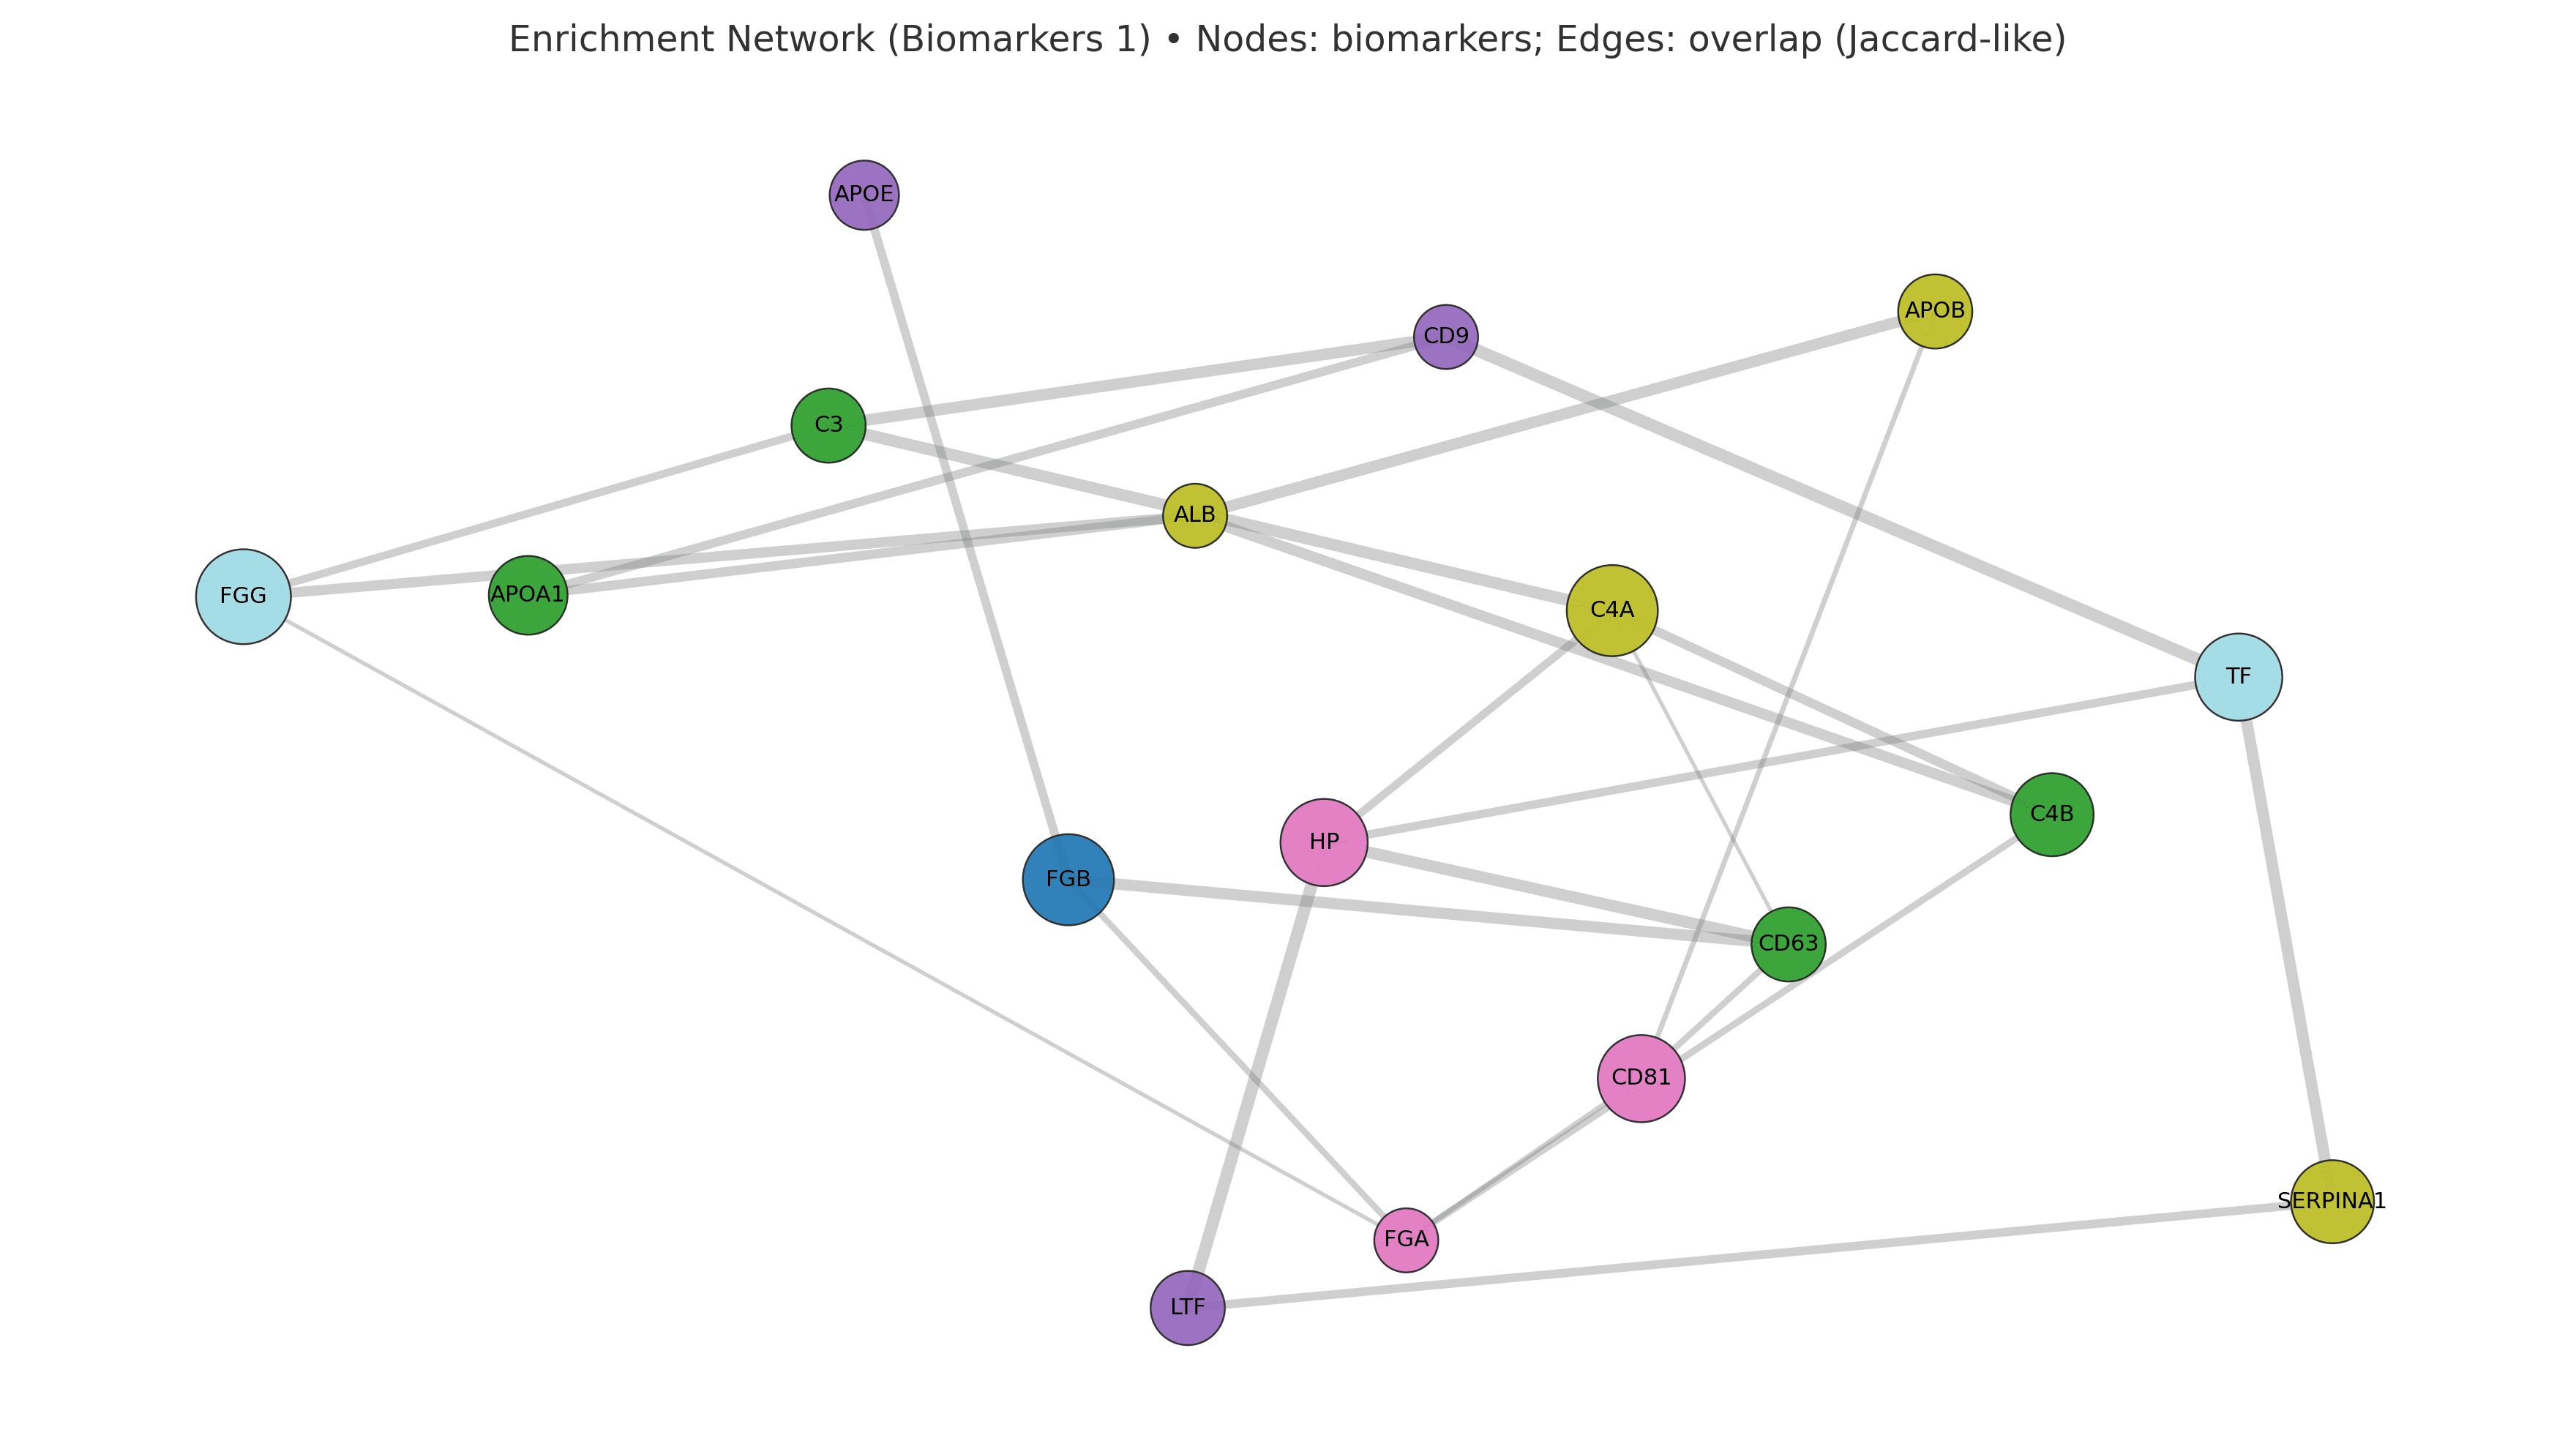
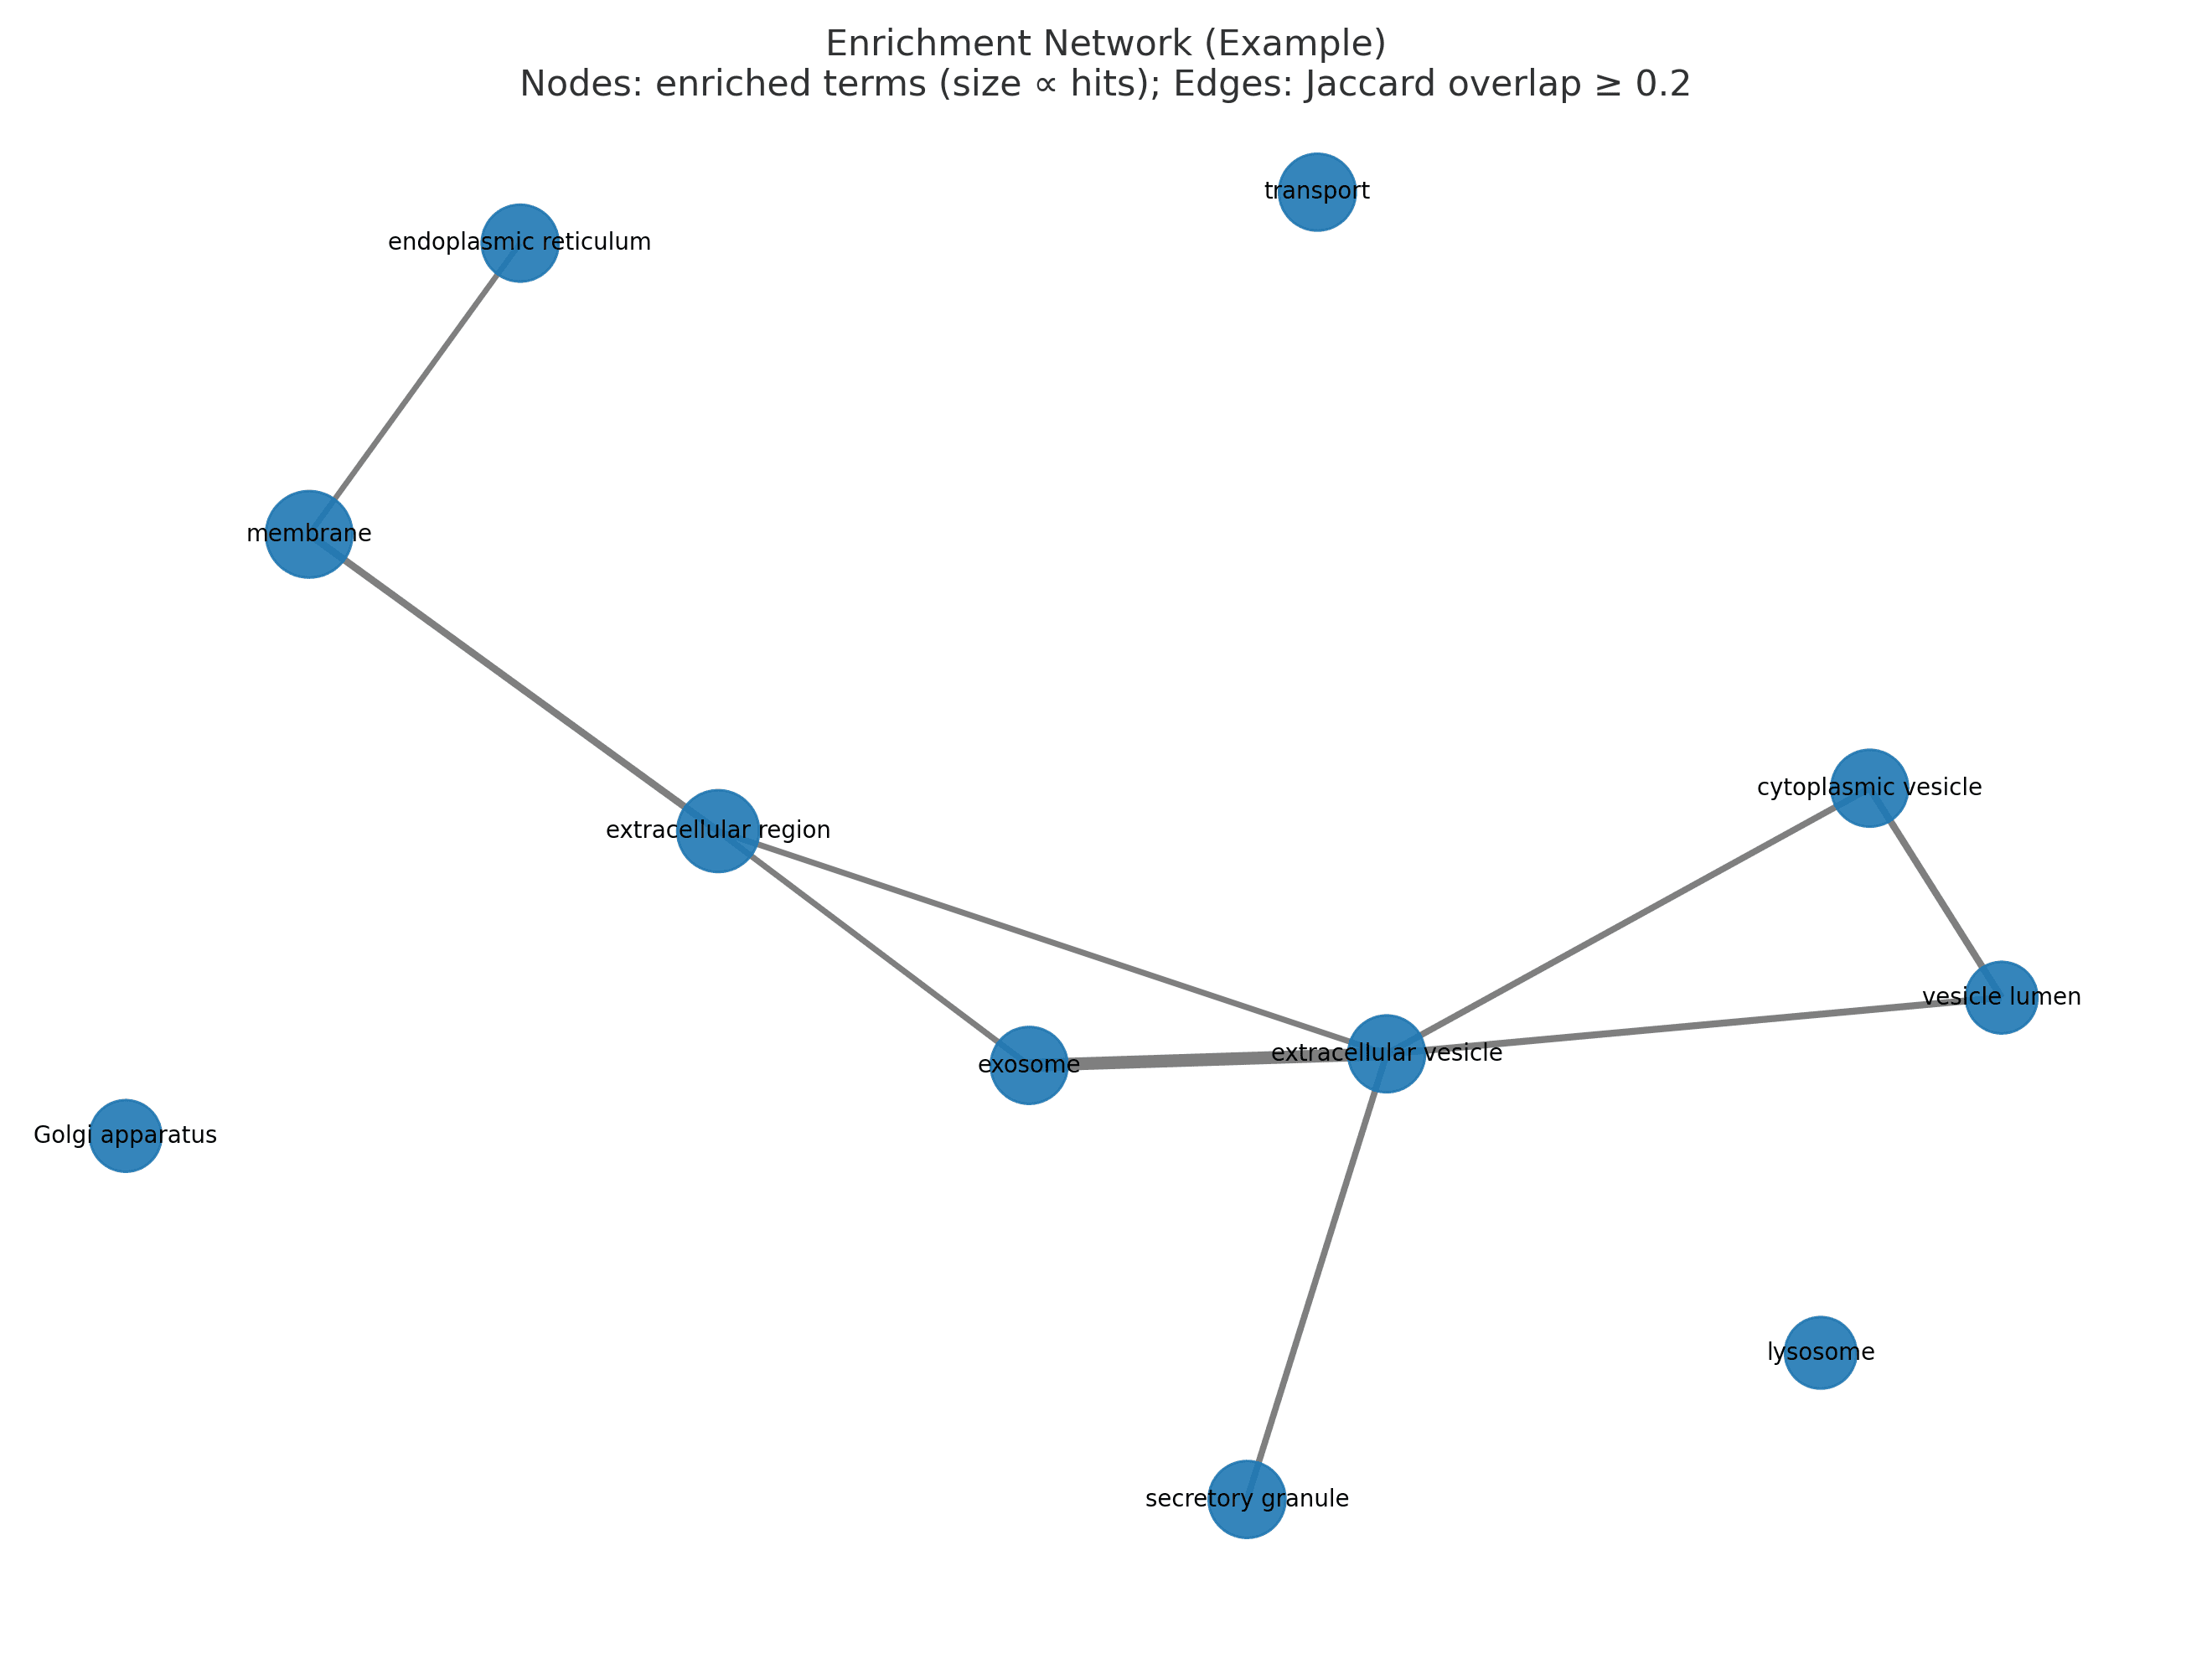
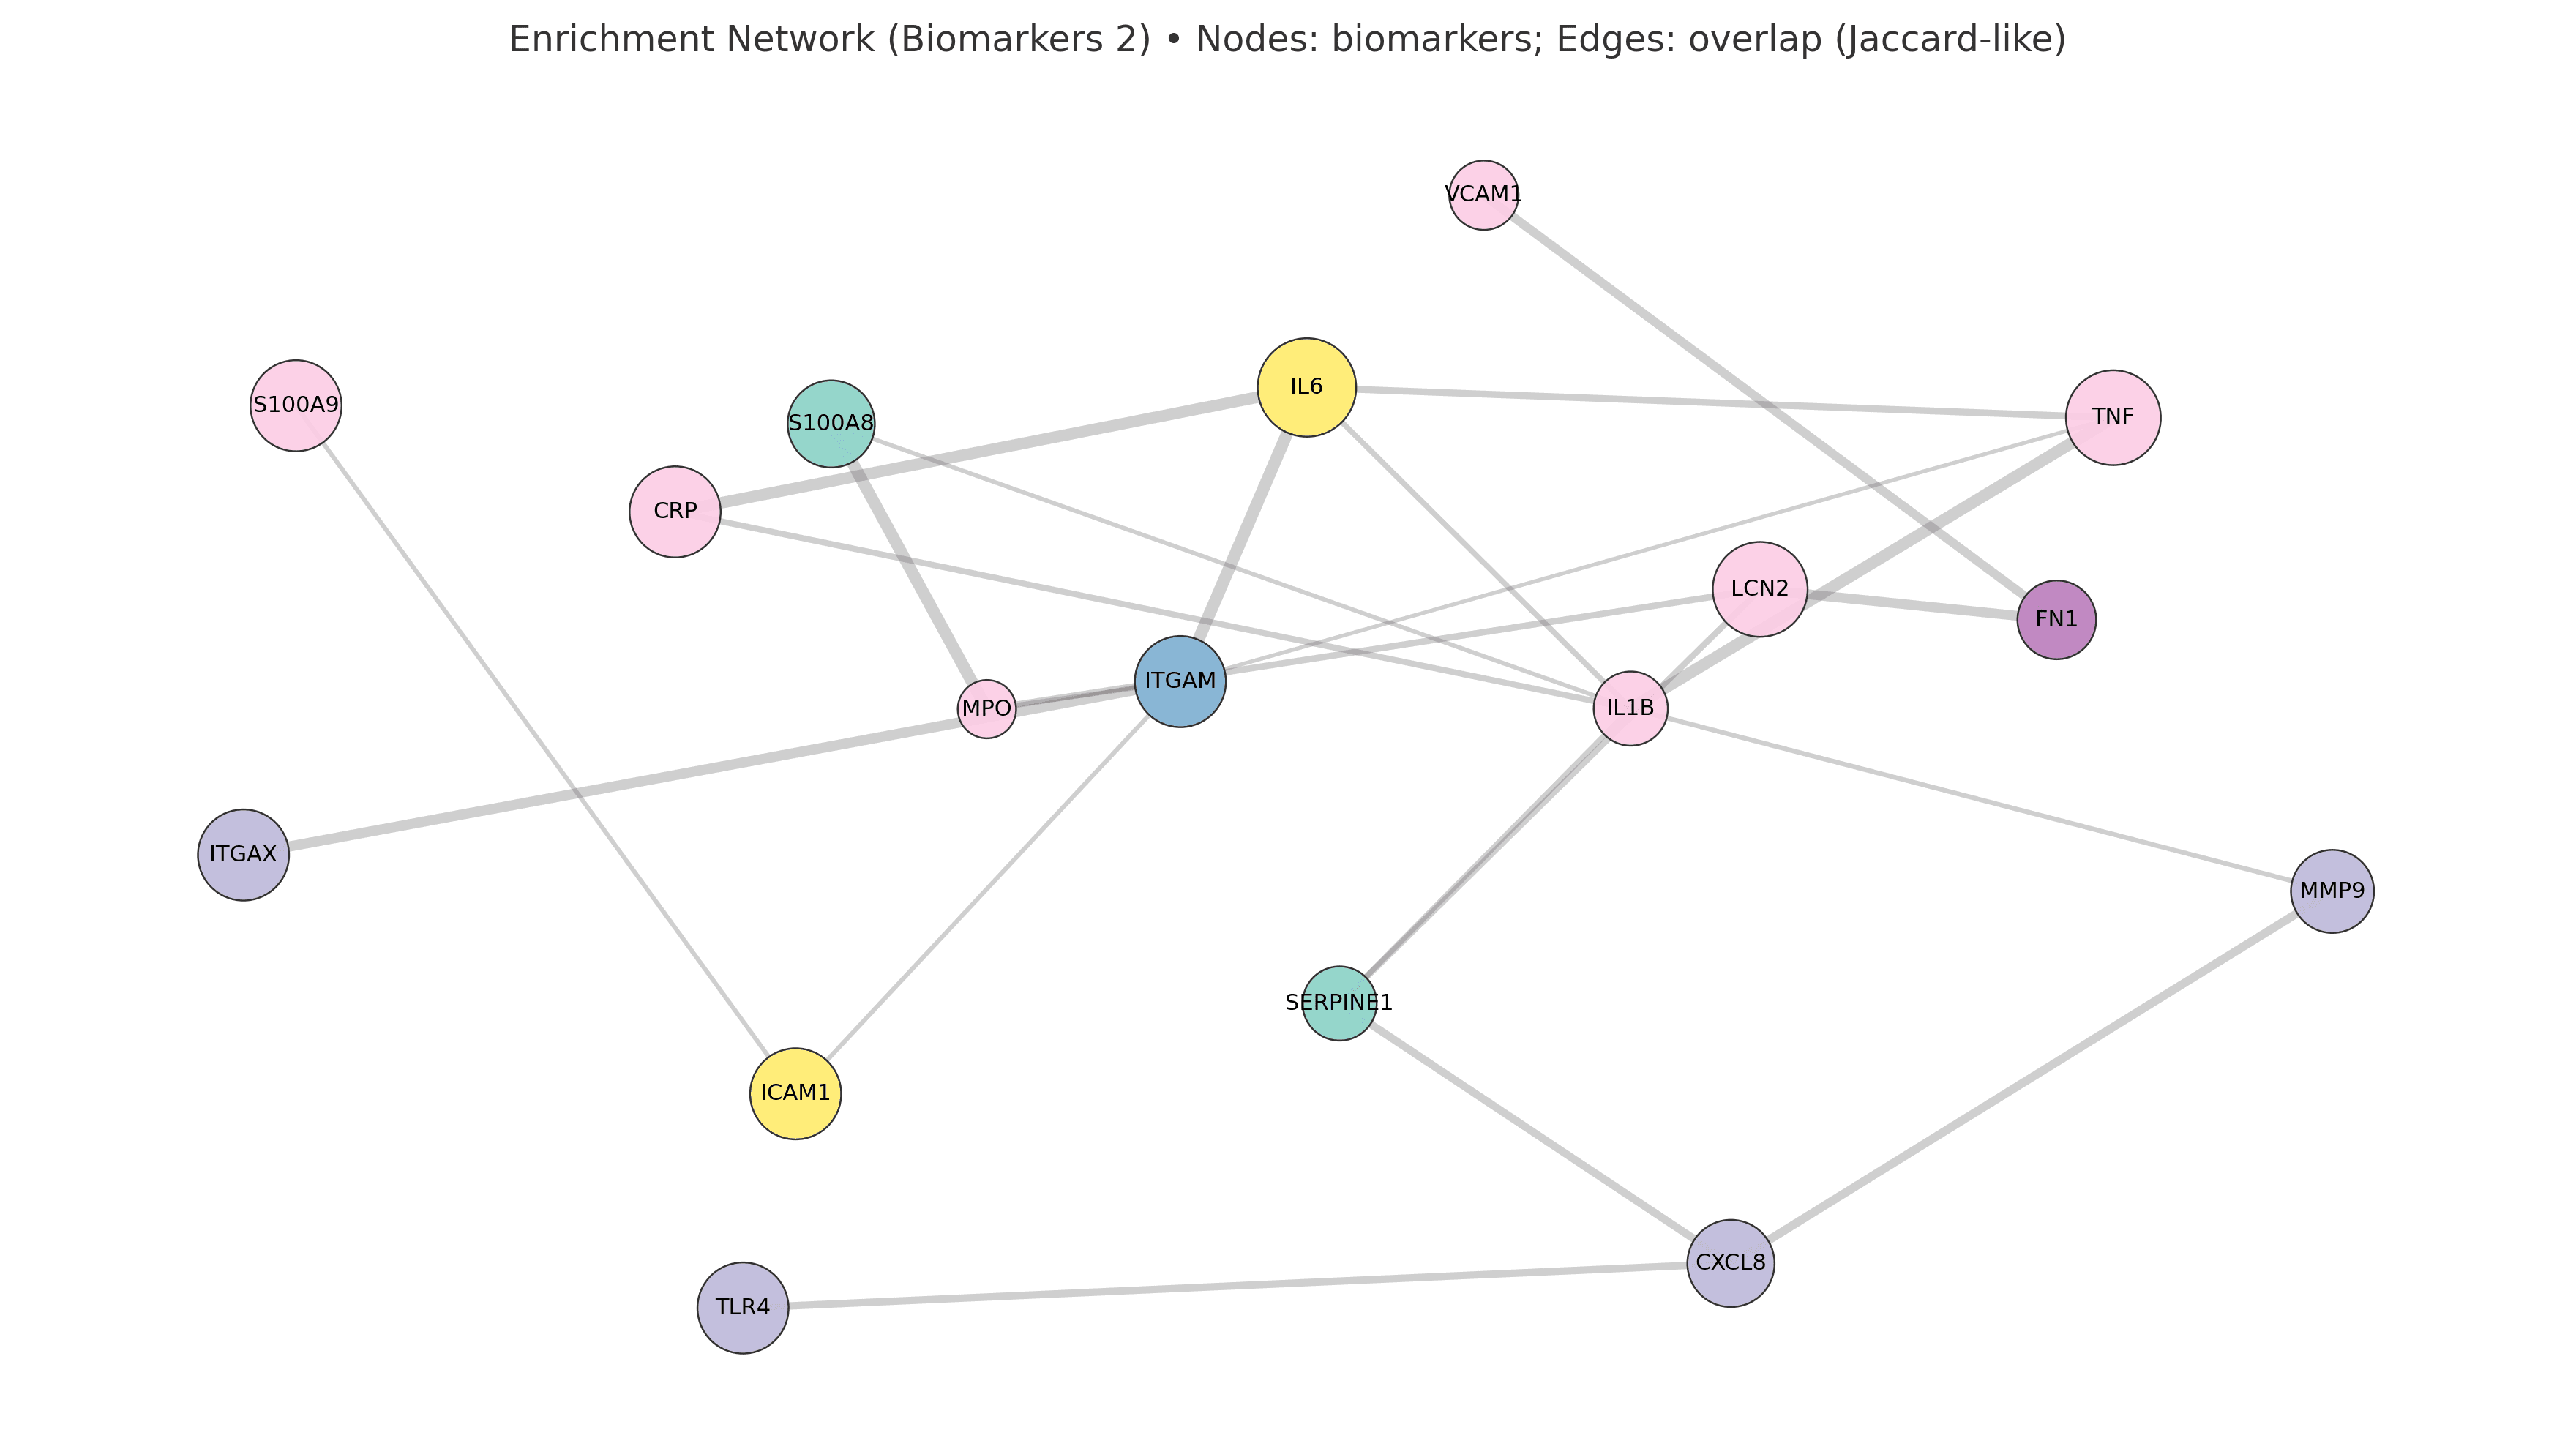
Nodes represent biomarkers; edges indicate pairwise overlap (Jaccard-like). These example networks are generic and can be adapted to any project or disease.